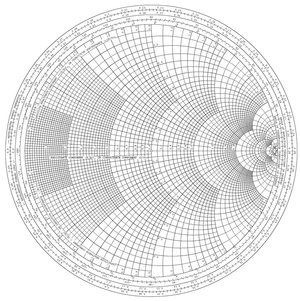
Smith chart
|
|
A Smith chart is a type of graph used in electrical engineering that shows how the complex impedance of a transmission line varies along its length, and simplifies the design of matching networks to match the line to its load.
Origin
It was invented by Phillip Smith in 1939, while he was working for RCA (although the Japanese engineer Kurakawa invented a similar device one year earlier). When asked why he invented this chart, Smith explained:
- "From the time I could operate a slide rule, I’ve been interested in graphical representations of mathematical relationships."
Mathematical basis
The basis for all Smith charts is the following equation:
- <math>\Gamma = \frac{z_L - z_O}{z_L + z_O}<math>
<math>\Gamma<math> is the complex reflection coefficient (also called the one-port scattering parameter s or <math>s_{11}<math>). <math>z_L<math> is the normalized impedance of the load of the line, and is equal to <math>Z_L/Z_0<math>, where:
- <math>Z_L<math> is the load impedance and
- <math>Z_0<math> is the characteristic impedance of the transmission line
The chart itself occurs in the complex plane - the horizontal axis is the real (resistive) component of the impedance, while the vertical axis is the imaginary (reactive) component of the impedance. The center of the chart corresponds to the case when the line and the load are matched, and the reflection coefficient is therefore zero. The perimeter of the chart corresponds to 100% reflection, and the angles printed around the perimeter indicate the phase of the reflection coefficient from zero to 180°, or half a wavelength.
Some Smith charts graph the admittance rather than the impedance. An admittance Smith chart is created by rotating an impedance Smith chart 180°. Another commonly used variant is the ZY Smith chart. It is constructed by overlaying the impedance and admittance chart, and useful if admittances and impedances are needed at the same time.
Although, in the age of computers, the paper Smith chart is used less frequently to solve problems, it is still a very useful way of displaying data. Students studying electromagnetism (RF-engineering in particular) are usually assigned problem-solving exercises using the chart, which remains an important teaching tool.
Measuring instruments often display their results in the form of a Smith chart, as do studies in academic journals.de:Smith-Diagramm zh:史密夫圖表 ja:スミスチャート

