
Image:Moment of inertia solid cylinder.png
|
|
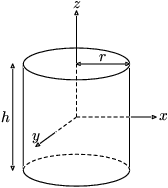
MetaPost image of a cylinder, with dimensions and axes specified. Embedded in a TeX document, viewed with gv, rasterized via screenshot, saved as PNG with The Gimp, and compressed with optipng.
MetaPost source of the image follows.
u=18mm;
textscale=u/12mm;
% this MetaPost script generates a PostScript file, which is then included in a
% TeX document. if you want to generate EPS from this, you'll have to uncomment
% the following line. (and probably do a couple more things, to boot.)
%prologues := 1;
def cylinder =
  begingroup;
  save pmax,dmax,persp,persp_nt,arr;
  save harrtop,harrbot,rarrlft,rarrrt;
  save p,d;
  save axisprotrusion;
  save xax,yax,zax;
  pmax = 3; dmax = 0;
  persp_nt = 0.3;
  persp = persp_nt*u;
  arr = 0.2u; % how far to offset the arrows from the diagram
  axisprotrusion = 1u;  % how far do the axes protrude?
  pair harrtop,harrbot,rarrlft,rarrrt; % endpoints for arrows
  path p[],d[]; % original, dotted
  pair xax[],yax[],zax[]; % x,y,z are taken; these are for the axes
  % solid paths
  p0 = (-1u,-1u)--(-1u,1u);
  p1 = (1u,-1u)--(1u,1u);
  p2 = fullcircle scaled u xscaled 2 yscaled (2*persp_nt) shifted (0,1u);
  p3 = halfcircle scaled u xscaled 2 yscaled (2*persp_nt) rotated 180 shifted (0,-1u);
  % dashed paths
  d0 = halfcircle scaled u xscaled 2 yscaled (2*persp_nt) shifted (0,-1u);
  % endpoints of dimension arrows
  harrtop = (-1u-arr,1u);
  harrbot = (-1u-arr,-1u);
  rarrlft = (0,1u);
  rarrrt = (1u,1u);
  % actually draw
  pickup pencircle scaled 1pt;
  for i=0 upto pmax:
    draw p[i];
  endfor;
  for i=0 upto dmax:
    draw d[i] dashed evenly;
  endfor;
  drawdblarrow (harrtop..harrbot);
  drawdblarrow (rarrlft..rarrrt);
  label.lft(btex $h$ etex scaled textscale,.5[harrtop,harrbot]);
  label.top(btex $r$ etex scaled textscale,.5[rarrlft,rarrrt]);
  % x axis
  xax0 = (0,0);
  xax1 = (1u,0);
  xax2 = (1u+axisprotrusion*0.5,0);
  drawarrow (xax1..xax2);
  draw xax0..xax1 dashed evenly;
  label.rt(btex $x$ etex scaled textscale,xax2);
  % y axis
  yax0 = (0,0);
  yax1 = point 1.5 of p3 shifted (0,1u);
  yax2 = (1.+axisprotrusion/u)[yax0,yax1];
  drawarrow (yax1..yax2);
  draw yax0..yax1 dashed evenly;
  label.top(btex $y$ etex scaled textscale,yax2);
  % z axis
  zax0 = (0,0);
  zax1 = (0,1u);
  zax2 = (0,1u+axisprotrusion);
  drawarrow (zax1..zax2);
  draw zax0..zax1 dashed evenly;
  label.top(btex $z$ etex scaled textscale,zax2);
  endgroup;
enddef;
beginfig(1)
  cylinder;
endfig;
bye
The original author (Grendelkhan) licenses the source, as well as the image generated from it, under the GFDL.
Missing image Heckert_GNU_white.png | Permission is granted to copy, distribute and/or modify this document under the terms of the GNU Free Documentation License, Version 1.2 or any later version published by the Free Software Foundation; with no Invariant Sections, no Front-Cover Texts, and no Back-Cover Texts. Subject to disclaimers. |
File links
There are no pages that link to this file.