Venn diagram
|
|
Venn diagrams, Euler diagrams (pronounced "oiler") and Johnston diagrams are similar-looking illustrations of set, mathematical or logical relationships.
| Contents |
Example
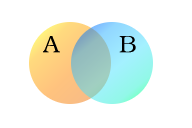
The Venn diagram above can be interpreted as "the relationships of set A and set B which may have some (but not all) elements in common". Where the sets intersect is called the intersection.
Missing image
Venn-diagram-ABC.png
Sets A, B and C
The Euler diagram above can be interpreted as "set A is a proper subset of set B, but set C has no elements in common with set B.
Or, as a syllogism
- All As are Bs
- No Cs are Bs
- Therefore No Cs are As.
Venn, Johnston, and Euler diagrams may be identical in appearance. Any distinction is in their domains of application, that is in the type of universal set that is being divided up. Johnston's diagrams are specifically applied to truth values of propositional logic, whereas Euler's illustrate specific sets of "objects" and Venn's concept is more generally applied to possible relationships. It is likely that the Venn and Euler versions have not been merged because Euler's version came 100 years earlier, and Euler has credit for enough accomplishment already, while Venn is left with nothing but this diagram.
The difference between Euler and Venn may be no more than that Euler's try to show relationships between specific sets, whereas Venn's try to include all possible combinations. With that in mind:
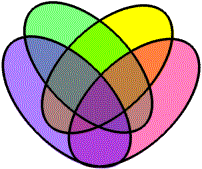
There was some struggle as to how to generalise to many sets. Venn got as far as four sets by using ellipses:
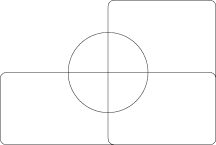
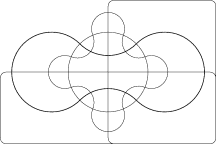
but was never satisfied with his five-set solutions. It would be more than a century before a means satisfying Venn's somewhat informal criteria of ‘symmetrical figures…elegant in themselves’ was found. In the process of designing a stained-glass window in memoriam to Venn, A. W. F. Edwards came up with ‘cogwheels’:
- three sets:

- four sets: Missing image
Edwards-Venn-four.png
image:Edwards-Venn-four.png
- five sets:

- six sets: Missing image
Edwards-Venn-six.png
image:Edwards-Venn-six.png
Ref: Ian Stewart Another Fine Math You've Got Me Into 1992 ch4
Origins
John Venn was a 19th-century British philosopher and mathematician who introduced the Venn diagram in 1881.
A stained glass window in Caius College, Cambridge, commemorates his invention.
See also
External links
- LogicTutorial.com (http://www.logictutorial.com/) - interactive Johnston diagram
- Lewis Carroll's Logic Game (http://www.cut-the-knot.org/LewisCarroll/dunham.shtml) - Venn vs. Euler
- A Survey of Venn Diagrams (http://www.combinatorics.org/Surveys/ds5/VennEJC.html)
- Venn Diagrams (http://www.cut-the-knot.org/LewisCarroll/Venn.shtml)
- Region Identification in Venn Diagrams (http://www.cut-the-knot.org/LewisCarroll/VennClick.shtml)
Tools for making Venn Diagrams
- http://www.venndiagram.com/venn01.html
- VennDiagrams [1] (http://sourceforge.net/projects/venn/)
- Microsoft Powerpoint (later versions)
- Winvenn: a venn diagram demo program for Windows 95. [2] (http://barnyard.syr.edu/software.shtml)
See also: Boolean algebra, Karnaugh map, Graphic organizersde:Mengendiagramm eo:Venn-a diagramo fr:Diagramme de Venn io:Venn-diagramo zh:文氏图


