Image:Ilyanepbyhour.png
|
|

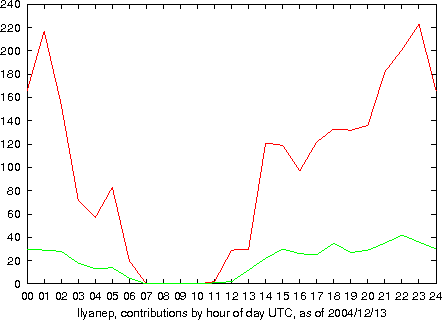
X=hour, Y=amt of edits per hour. The red graph shows total edits in that hour while the green graph discounts multiple edits in a day -- therefore showing how many days I have edited in that hour. Thanks to user VV for making this graph.
Missing image Heckert_GNU_white.png | Permission is granted to copy, distribute and/or modify this document under the terms of the GNU Free Documentation License, Version 1.2 or any later version published by the Free Software Foundation; with no Invariant Sections, no Front-Cover Texts, and no Back-Cover Texts. Subject to disclaimers. |
File links
There are no pages that link to this file.
