Histogram
|
|
In statistics, a histogram is a graphical display of tabulated frequencies. That is, a histogram is the graphical version of a table which shows what proportion of cases fall into each of several or many specified categories. The categories are usually specified as nonoverlapping intervals of some variable.
There are different ways to display the same table, and two kinds of histograms are shown below. One shows the number of cases per unit interval, so that the area under the curve is the total number of cases. Another shows the number of cases per unit interval divided by the total number of cases, so that the area under the curve is exactly 1.
As an example we consider data collected by the U.S. Census Bureau on time to travel to work (2000 census, [1] (http://www.census.gov/prod/2004pubs/c2kbr-33.pdf), Table 5). The census found that there were 124 million people who work outside of their homes. People were asked how long it takes them to get to work, and their responses were divided into categories: less than 5 minutes, more than 5 minutes and less than 10, more than 10 minutes and less than 15, and so on. This table shows the numbers of people per category in thousands, so the 4,180 means 4,180,000.
| Interval | Width | No. in interval | (No. in interval)/width |
| 0 | 5 | 4,180 | 836 |
| 5 | 5 | 13,687 | 2,737 |
| 10 | 5 | 18,618 | 3,723 |
| 15 | 5 | 19,634 | 3,926 |
| 20 | 5 | 17,981 | 3,596 |
| 25 | 5 | 7,190 | 1,438 |
| 30 | 5 | 16,369 | 3,273 |
| 35 | 5 | 3,212 | 642 |
| 40 | 5 | 4,122 | 824 |
| 45 | 15 | 9,200 | 613 |
| 60 | 30 | 6,461 | 215 |
| 90 | 60 | 3,435 | 57 |
The data shown in the preceding table are displayed graphically by the following diagram. The area of each bar is equal to the total number of people in that category, so the total area of all bars is equal to the total number of people in the survey (124 million).
An interesting feature of this diagram is the spike in the 30 to 35 minutes category. It seems likely that this is an artifact: half an hour is a common unit of informal time measurement, so people whose travel times were perhaps a little less than or a little greater than 30 minutes might be inclined to answer "30 minutes".
Travel_time_histogram_total_n.png
Image:Travel_time_histogram_total_n.png
Histogram of travel time, US 2000 census. Area under the curve equals the total number of cases.
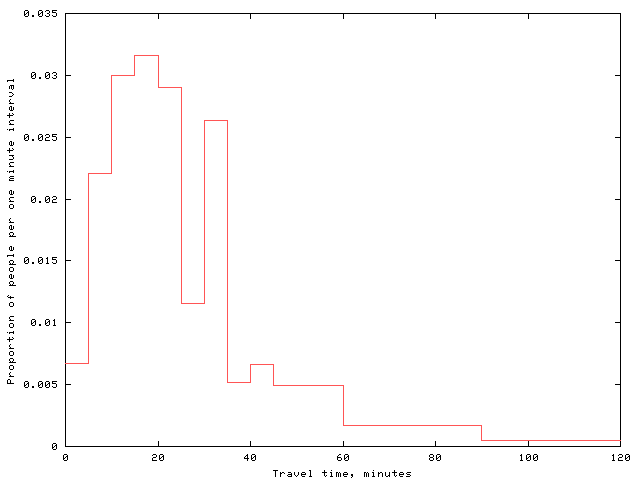
Now the same data are shown in a slightly different fashion. The area of each bar is equal to the proportion of people, of all the people in the survey, who fall into that category. So the total area of all the bars is equal to 1.
| Interval | Width | No. in interval | (No. in interval)/(total no.)/width |
| 0 | 5 | 4,180 | 0.0067 |
| 5 | 5 | 13,687 | 0.0220 |
| 10 | 5 | 18,618 | 0.0300 |
| 15 | 5 | 19,634 | 0.0316 |
| 20 | 5 | 17,981 | 0.0289 |
| 25 | 5 | 7,190 | 0.0115 |
| 30 | 5 | 16,369 | 0.0263 |
| 35 | 5 | 3,212 | 0.0051 |
| 40 | 5 | 4,122 | 0.0066 |
| 45 | 15 | 9,200 | 0.0049 |
| 60 | 30 | 6,461 | 0.0017 |
| 90 | 60 | 3,435 | 0.0004 |
The preceding table is displayed graphically by the following diagram. The second figure differs from the first only in the vertical scale. Which figure should be used depends on the purpose of the histogram; if the absolute numbers are important, then the first form is more useful, and the second form is more useful if proportions are important.
External links
- Journey To Work and Place Of Work (http://www.census.gov/population/www/socdemo/journey.html) (location of census document cited in example)
- Teach/Me Data Analysis (http://www.vias.org/tmdatanaleng/cc_histogram.html)de:Histogramm
it:Istogramma nl:Histogram pl:Histogram ru:Гистограмма sv:Histogram

