Contour line
|
|
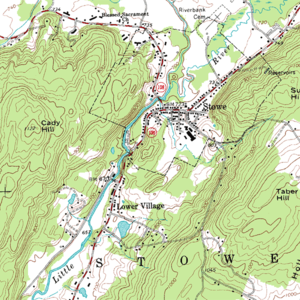
A contour line (also isopleth, level set, isogram or isarithm) for a function of two variables is a curve connecting points where the function has a particular value. A contour map is a map showing contour lines.
The gradient of the function is always perpendicular to the contour lines. When the lines are close together the gradient is large: the variation is steep. If adjacent contour lines are of the same width, the direction of the gradient cannot be determined from the contour lines alone. However if contour lines rotate through three or more widths the direction of the gradient can also be determined from the contour lines.
Different types of contour lines are given different names according to the nature of the quantity involved:
- elevation: contour lines on a topographic map
- pressure: isobar.
- temperature: isotherm.
- dew point: isodrosotherm.
- humidity: isohume.
- wind speed: isotach.
- wind direction: isogon.
- solar radiation: isohel
- liquid precipitation amount: isohyet.
- economic production: isoquant.
- presence of linguistic feature: isogloss
"Iso" can be replaced with "isallo" to give it the meaning of a line connecting points where some variable has changed at the same rate during some time period.
External links
- Drawing Contour Plots (http://avc.comm.nsdlib.org/cgi-bin/wiki_print.pl?Drawing_Contour_Plots). A lesson plan that deals with drawing various isopleths.
- See also Forthright's Phrontistery (http://phrontistery.info/contour.html) for many more different types of isopleths.de:Isolinie

