Anti-aliasing
|
|
| Missing image Aliased.png Image:aliased.png (a)
|  (b)
|  (c)
|
Figure 1
|
In digital signal processing, anti-aliasing is the technique of minimizing aliasing when representing a high-resolution signal at a lower resolution.
In most cases, anti-aliasing means removing data at too high a frequency to represent. When such data is left in a signal, it causes unpredictable artifacts such as the black-and-white noise near the top of figure 1-a.
See the articles on signal processing and aliasing for more information about the theoretical justifications for anti-aliasing; the remainder of this article is dedicated to anti-aliasing methods in computer graphics.
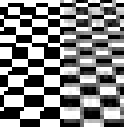
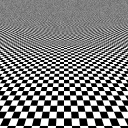
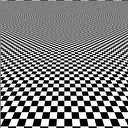
Figure 1-a illustrates that visual distortion which occurs when anti-aliasing is not used. Notice that near the top of the image, where the checkerboard is very distant, the image is impossible to recognize, and is displeasing to the eye. By contrast, figure 1-b is anti-aliased. The checkerboard near the top blends into gray, which is usually the desired effect when the resolution is insufficient to show the detail. Even near the bottom of the image, the edges appear much smoother in the anti-aliased image. Figure 1-c shows another anti-aliasing algorithm, based on the sinc filter, which is considered better than the algorithm used in 1-b. Figure 2 shows magnified portions of Figure 1 for comparison. The left half of the image is taken from Figure 1-a, and the right half of the image is taken from Figure 1-c. Observe that the gray pixels, which aren't very attractive at that size, help make 1-c much smoother than 1-a.
  |
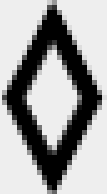 |
| Compare the diamond on the left with the antialiased one on the right | |
| Enlarged view | |
| Figure 3 | |
Fig 3 shows the effect of anti-aliasing on a small black and white image. The enlarged image shows how anti-aliasing adds gray pixels around the border between black and white, which visually smooths the outline. Text is affected in just the same way.
| Contents |
First-principles approach to anti-aliasing
The idealized image has infinite detail, and we represent it using a function f(x,y) where x and y are real numbers defining coordinates.
There are infinitely many such functions. However, the computer screen is capable of displaying only finitely many different images. Indeed, an ordinary computer screen has no more than a few million pixels, and each pixel only has a finite number of colors it can display.
Hence, to convert an image f(x,y) into something that the screen can display, we must simplify it. By the pigeonhole principle, sometimes two different ideal images f(x,y) and g(x,y) will be converted to the same picture on the screen. This cannot be avoided. The question is how to choose the reduced image so that it looks better.
An example of a poor choice is illustrated in Figure 1-a. The most direct way to simplify an image for display is to use a sample of the image at f(i,j) for each pixel (i,j). That is how figure 1-a was generated. At the top of the checkerboard, multiple black and white tiles may be represented by a single pixel. But since only black and white points occur in the ideal image, an area containing both colors in similar proportion will be represented with a strange pattern of black and white. This type of aliasing is called a Moiré effect.
A better approach is, for each pixel, use the average intensity of a rectangular area in the scene corresponding to the surface area of said pixel. This gives a better, but not yet ideal, "anti-aliased" appearance; figure 1-b was generated this way. To see why this works better, it helps to look at the problem from a signal-processing perspective.
Signal processing approach to anti-aliasing
In this approach, the ideal image is regarded as a signal, the image displayed on the screen is viewed as a certain filtering of the signal. Ideally, we would understand how the human brain would process the original signal, and provide the image on the screen which most resemble the original signal according to the human brain.
The most widely accepted method is to use the Fourier transform. The Fourier transform decomposes our signal into basic waves, or harmonics, and gives us the amplitude of each wave in our signal. The waves are of the form:
- <math>\cos (2j \pi x) \cos (2k \pi y)<math>
where j and k are arbitrary non-negative integers. (In fact, there are also waves involving the sine, but for the purpose of this discussion, the cosine will suffice; see Fourier transform for technical details.)
The number j and k together are the frequency of the wave: j is the frequency in the x direction, and k is the frequency in the y direction.
It has been observed that to measure a signal of frequency n, you need at least n sample points, and they need to be well-placed. If your sample points occur near the zeros of the signal, you will be led to the belief that the signal is in fact zero.
And so, in signal processing, we choose to eliminate all high frequencies from the signal, keeping only the frequencies that are low enough to be sampled correctly by our sample rate.
Although there is no known justification why this form of aliasing is less troublesome than some other form of averaging, such as the uniform averaging algorithm, experimentation with humans has suggested that the Fourier approach is superior and somehow matches what the brain would expect to see.
Figure 1-c was generated with this approach. It is unfortunately impossible to do the exact calculation correctly; however, an approximation was used which we hope comes close to the correct image. To highlight the differences between 1-b and 1-c, observe that 1-c manages to be a bit clearer further up on the image than 1-b does. We are able to distinguish some texture other than uniform gray higher up on the image in 1-c than in 1-b.
The basic waves need not be cosine waves. See, for instance, wavelets. If one uses basic waves which are not cosine waves, one obtains a slightly different image. Some basic waves yield anti-aliasing algorithms which are not so good (for instance, the Haar wavelet gives the uniform averaging algorithm.) However, some wavelets are good, and it is possible that some wavelets are better at approximating the functioning of the human brain than the cosine basis.
Practical real-time anti-aliasing approximations
There are only a handful of primitives used at the lowest level in a real-time rendering engine (either software or hardware accelerated.) These include "points", "lines" and "triangles". If one is to draw such a primitive in white against a black background, it is possible to design such a primitive to have fuzzy edges, achieving some sort of anti-aliasing. However, this approach has difficulty dealing with adjacent primitives (such as triangles that share an edge.)
To approximate the uniform averaging algorithm, one may use an extra buffer for sub-pixel data. The initial, and least memory-hungry approach, used 16 extra bits per pixel, in a 4×4 grid. If one renders the primitives in a careful order, for instance front-to-back, it is possible to create a reasonable image.
Since this requires that the primitives be in some order, and hence interacts poorly with an application programming interface such as OpenGL, the latest attempts simply have two or more full sub-pixels per pixel, including full color information for each sub-pixel. Some information may be shared between the sub-pixels (such as the Z-buffer.)
Mipmapping
Main article: Mipmap
There is also an older approach specialized for texture mapping called mipmapping, which does not require any sub-pixel samples, and in fact can improve the speed of the rendering by improving locality of reference, hence improving the performance of any cache system.
Mipmapping works by creating lower resolution, prefiltered versions of the texture map. When rendering the image, the appropriate resolution mip-map is chosen and hence the texture pixels (texels) are already filtered when they arrive on the screen.
Typically, if a texture is of resolution 256×256 (for instance) then mipmaps will be created with the following resolutions: 128×128, 64×64, 32×32, 16×16, 8×8, 4×4, 2×2 and 1×1. The advantage here is that having such a hierarchy of texture maps requires only 1/3 more memory than having simply the base 256×256 texture map. However, in many instances, the filtering should not be uniform in each direction (it should be anisotropic, as opposed to isotropic), and a compromise resolution is used. If a higher resolution is used, the cache coherence goes down, and the aliasing is increased in one direction, but the image tends to be clearer. If a lower resolution is used, the cache coherence is improved, but the image is overly blurry, to the point where it becomes difficult to identify.
To help with this problem, nonuniform mipmaps (also known as rip-maps) are sometimes used. With a 16×16 base texture map, the rip-map resolutions would be 16×8, 16×4, 16×2, 16×1, 8×16, 8×8, 8×4, 8×2, 8×1, 4×16, 4×8, 4×4, 4×2, 4×1, 2×16, 2×8, 2×4, 2×2, 2×1, 1×16, 1×8, 1×4, 1×2 and 1×1.
The unfortunate problem with this approach is that rip-maps require four times as much memory as the base texture map, and so rip-maps have been very unpopular.
To reduce the memory requirement, and simultaneously give more resolutions to work with, summed-area tables were conceived. Given a texture <math>(t_{jk})<math>, we can build a summed area table <math>(s_{jk})<math> as follows. The summed area table has the same number of entries as there are texels in the texture map. Then, define
- <math>s_{mn}:=\sum _{1 \leq j \leq m,\ 1 \leq k \leq n} t_{jk}.<math>
Then, the average of the texels in the rectangle (a1,b1] × (a2,b2] is given by
- <math>{s_{a_2b_2}-s_{a_1b_2}-s_{a_2b_1}+s_{a_1b_1} \over {(a_2-a_1)(b_2-b_1)}}.<math>
However, this approach tends to exhibit poor cache behavior. Also, a summed area table needs to have wider types to store the partial sums <math>s_{jk}<math> than the word size used to store <math>t_{jk}<math>. For these reasons, there isn't any hardware that implements summed-area tables today.
A compromise has been reached today, called anisotropic mip-mapping. In the case where an anisotropic filter is needed, a higher resolution mipmap is used, and several texels are averaged in one direction to get more filtering in that direction. This has a somewhat detrimental effect on the cache, but greatly improves image quality.
History
Important early works in the history of anti-aliasing include:
- Freeman, H.. "Computer processing of line drawing images", ACM Computing Surveys vol. 6(1), March 1974, pp. 57–97.
- Crow, Franklin C.. "The aliasing problem in computer-generated shaded images", Communications of the ACM, vol. 20(11), November 1977, pp. 799–805.
- Catmull Edwin. "A hidden-surface algorithm with anti-aliasing", Proceedings of the 5th annual conference on Computer graphics and interactive techniques, p.6–11, August 23–25, 1978.
Related topics
- Dithered ray tracing and anti-aliasing
- Statistical sampling and anti-aliasing
- Temporal anti-aliasing or motion blur
- Measure theory and anti-aliasing
- Font rasterization and anti-aliasing
- Interpolation and Gamma Correction (http://home.no.net/dmaurer/~dersch/gamma/gamma.html) In most real-world systems, gamma correction is required to linearise the response curve of the sensor and display systems. If this is not taken into account, the resultant non-linear distortion will defeat the purpose of anti-aliasing calculations based on the assumption of a linear system response.
- Color theory for certain physical details pertinent to images which are not grayscale.
- reconstruction filter
- quincunx (pattern used for aliasing)
External links
- Examples of aliasing with uniform and non-uniform sampling (http://graphics.ucsd.edu/~wang/graphics/sampling/sampling.html#Top)da:Antialiasing
de:Antialiasing fr:Anticrénelage nl:Anti-kartelvorming no:Antialiasing ja:アンチエイリアス pl:Antyaliasing sv:Kantutjämning

